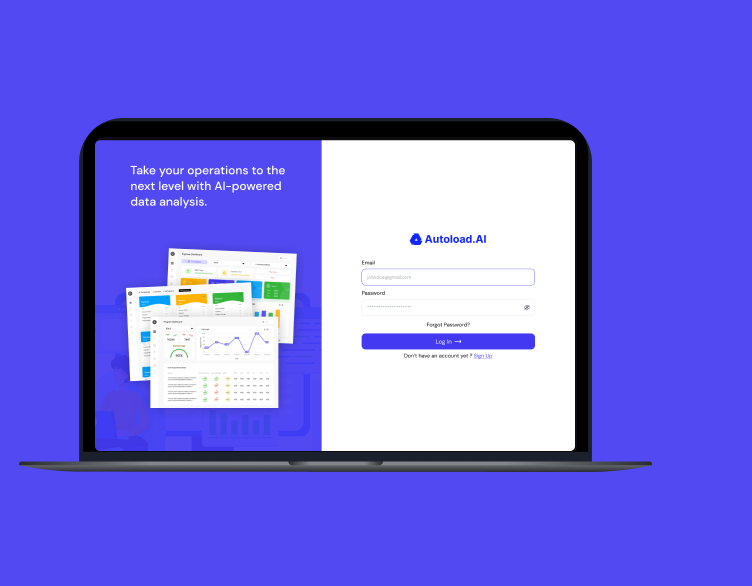
AutoLoad is a feature in software that automatically loads or imports modules when needed, simplifying code management and reducing manual effort.
Industry:
Service
Business Type:
Enterprise
Services:
Web Development & Deployment
Project Outline
AutoLoad is crucial for evaluating the performance, scalability, and reliability of the system under various conditions. By automating the load testing process, organizations can efficiently and consistently assess how their applications or systems respond to different user loads without the need for manual intervention. This enables faster testing cycles, more accurate results, and better identification of performance bottlenecks and potential issues.
Our Role
Web Development
Deployment
Quality Analysis
Technology Stacks

Angular

CSS
Type Script

HTML

ApexChart
What Autoload.ai Needed?
Auto Load is needed to ensure that software systems can handle user traffic effectively. By automating the simulation of real-world usage, it identifies performance issues, assesses scalability, and helps optimize system performance.

Website
Get the performance reports at finger tips that allows to understand and fix application performance issues faster than anyone else.

Thick Client
Get your thick clients performance tested with Autoload AI to get the most optimized infrastructure recommendations and fix the core engineering issues

Web Services/API
We supports SOAP, RESTful API performance testing by cutting down whopping 90% scripting time.
Project features
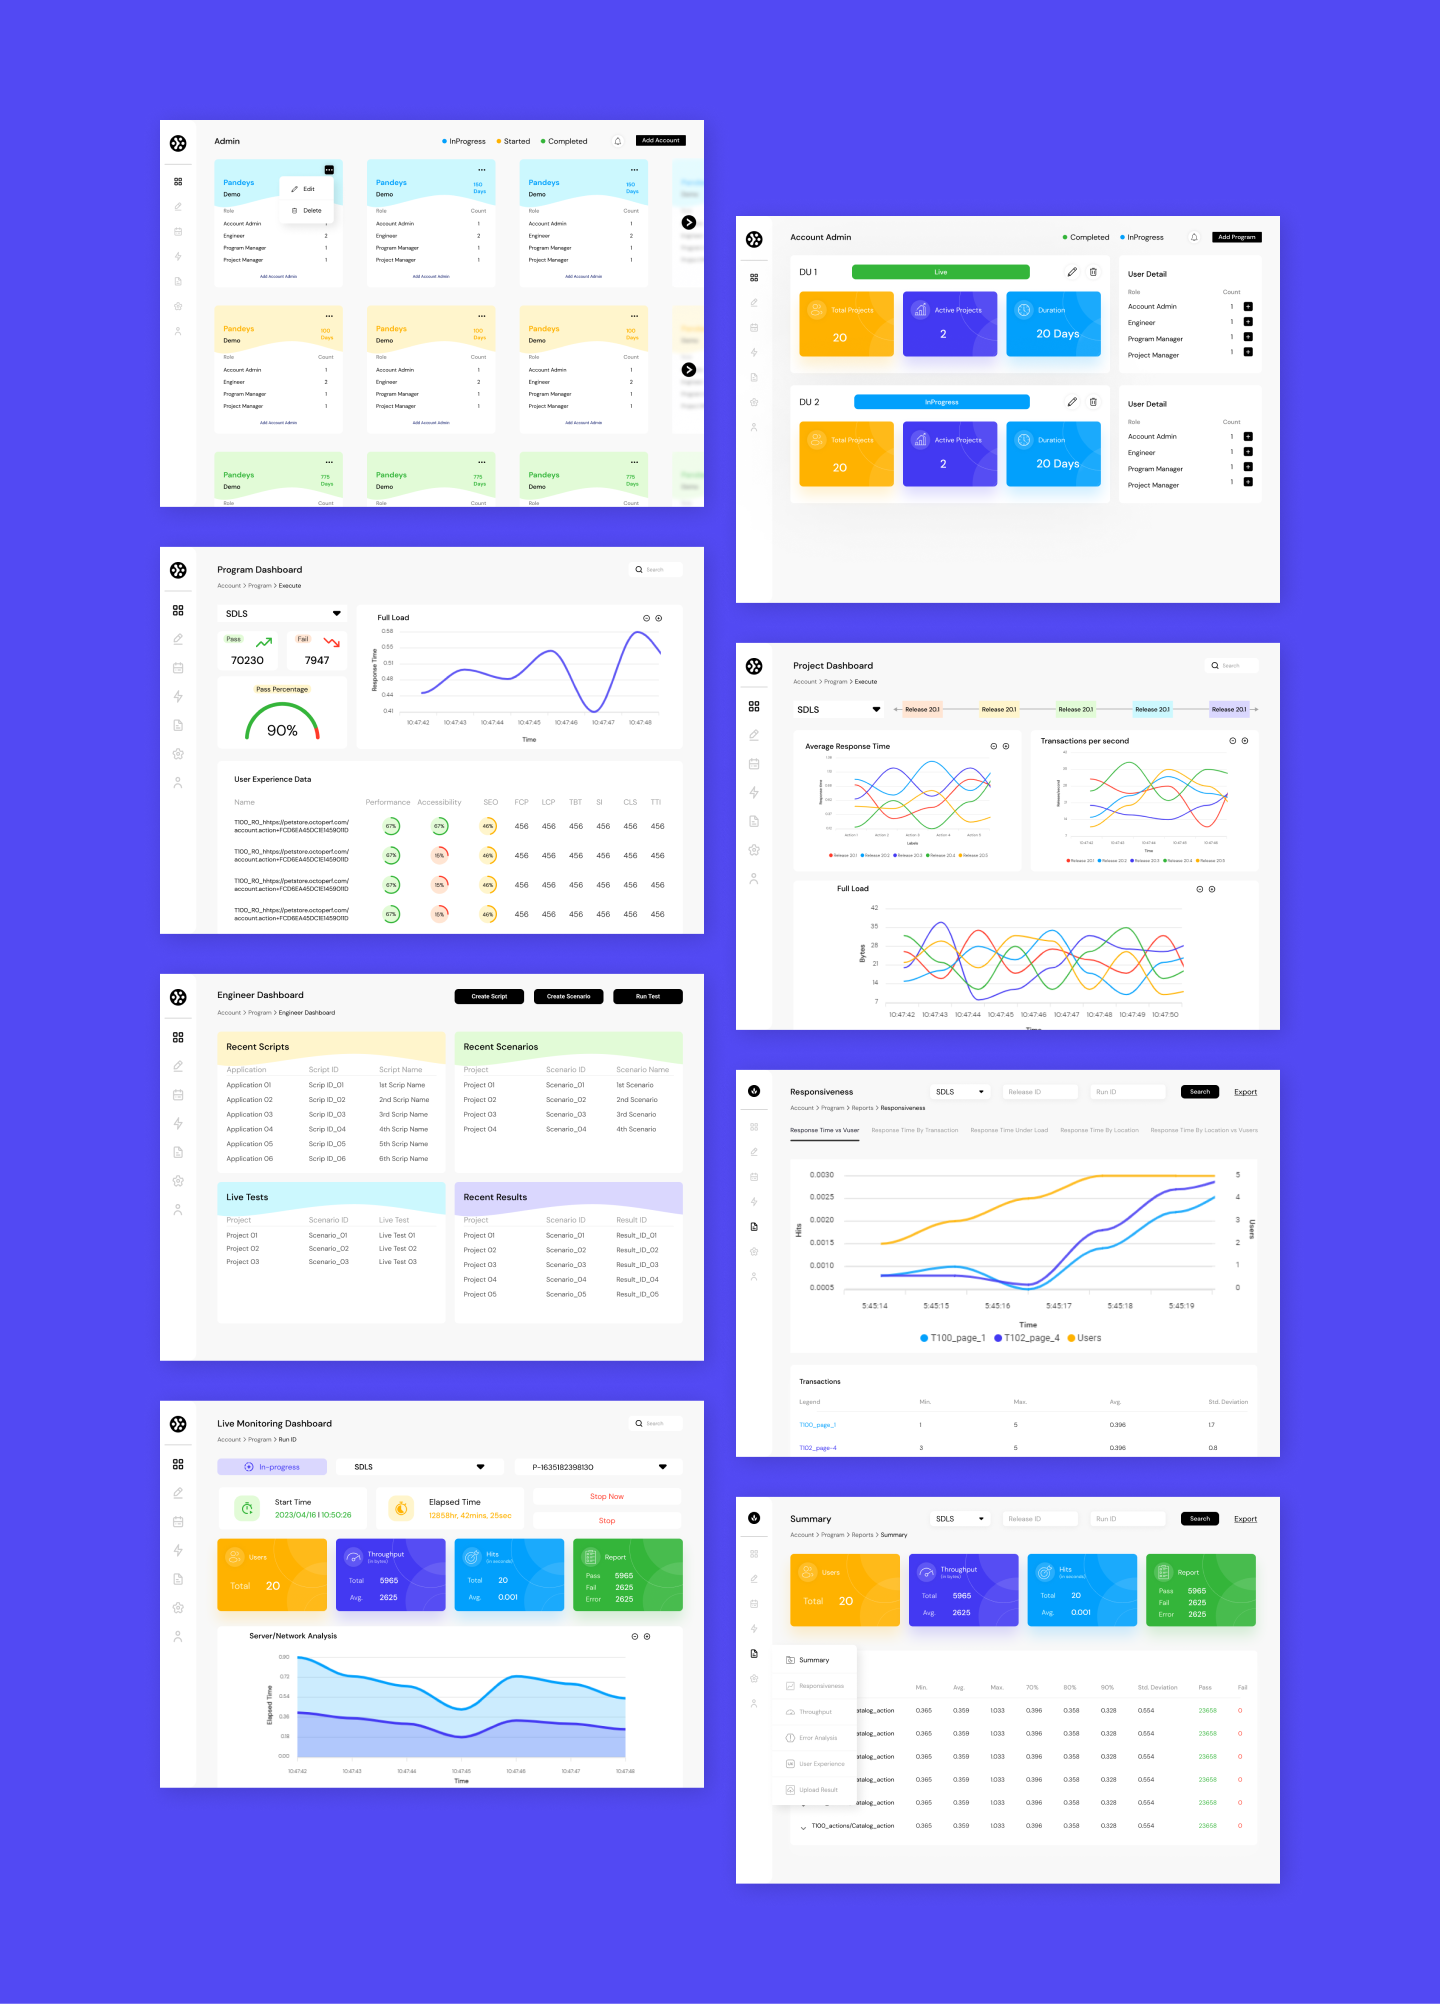
Auto Load features can be enhanced by utilizing graph performance analysis. Graph performance analysis involves representing performance metrics in graphical form, which offers a more visual and insightful way to interpret the data.

Graph

Perfomance

Live Monitoring

Load testing

Our Solution for Autoload.ai
Our AutoLoad solution automates module loading, simplifying code management and improving development efficiency. No more manual loading, just seamless integration for optimal performance.

Live Monitoring
Graphs provide real-time monitoring of performance metrics during load testing. Live graphs display data as the test progresses, enabling testers and developers to observe performance trends and spot anomalies immediately.

Performance Visualization
Graphs offer a visual representation of performance metrics like response times, throughput, and error rates. Visualizing data makes it easier to identify patterns, spikes, and trends, facilitating quick understanding of system behavior under different loads.

Load Distribution
Graphs can illustrate how the system distributes the load across different components, such as servers or databases. This helps pinpoint potential bottlenecks and areas needing optimization.

Words from our Client
Thanks to UXDLAB, our work environment is now healthier and more efficient. The Autoload app, coupled with their expert dashboard design and seamless technology, has automated our employees’ work management. We highly recommend UXDLAB for their exceptional digital engineering support.

dream project into a reality.

